Not sure if any of us can provide a name of the project from our professional life which followed the plan 100%. Projects are highly unlikely to follow the plan. In order to be able to identify and measure the differences between the plan and the actual work performance, progress on the project is required to be controlled and monitored. This is where S-Curve, a great project management tool plays a vital role.
What is “S”
The reason why it’s called an S curve is not a very technical one. It’s because of the S-shape that the graph makes.
During the early stages, the project is starting to unravel, and the team members have just beginning to engage in the first phase of project i.e Initiation and Planning. As more and more progress is made, the growth suddenly starts to speed up, this is usually an execution phase of the project. If you want to this rapid growth in the graph, it will be the middle part of the ‘s’. The point which exhibits the maximum growth is called the point of inflection. After passing the point of inflection, the growth plateaus and forms the upper part of the s-curve. This part is called the upper asymptote. Basically, this is the mature phase of the project or you could say the Closing phase of the Project.
Common Uses
Performance and Progress Evaluation
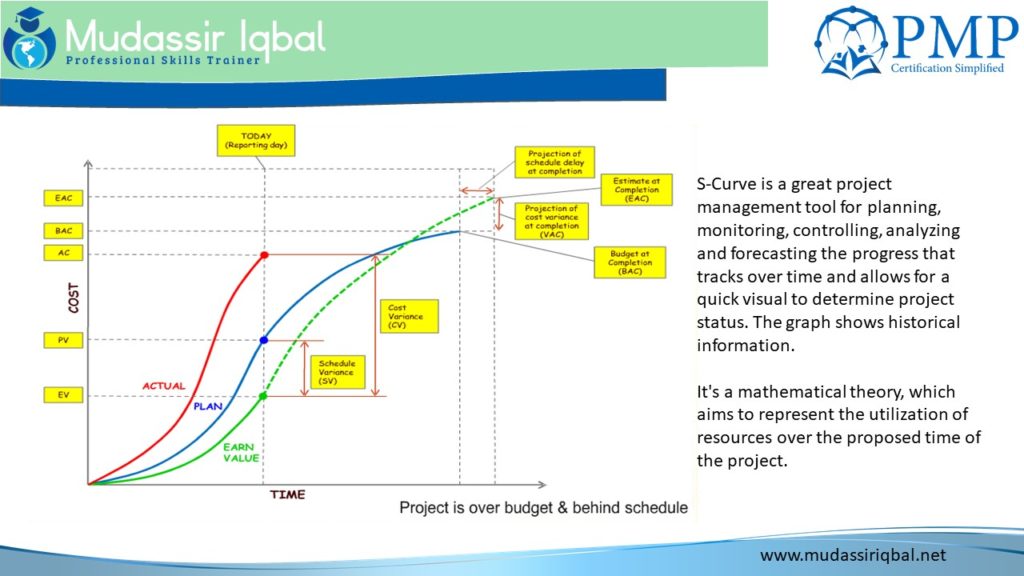
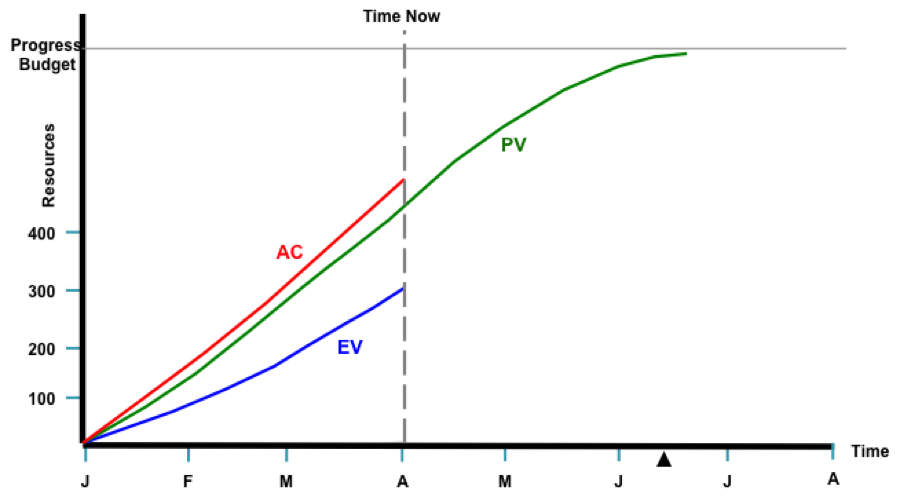
First and foremost, S-curves are used in evaluating the progress of the project in question and its performance. This is achieved through the use of Earned Value Management.
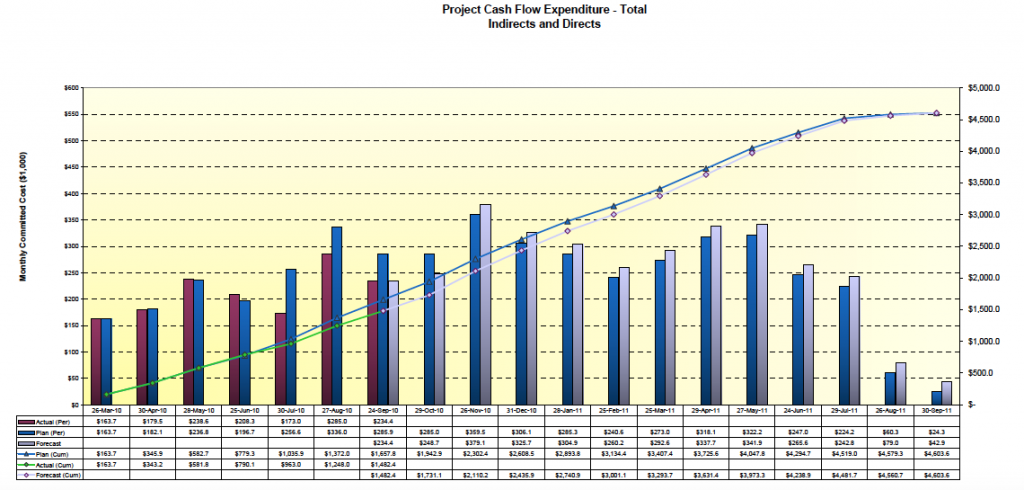
Cash flow forecast
Cash Flow is the timing and the movement of the cash with respect to the tasks and events happening during the project execution.
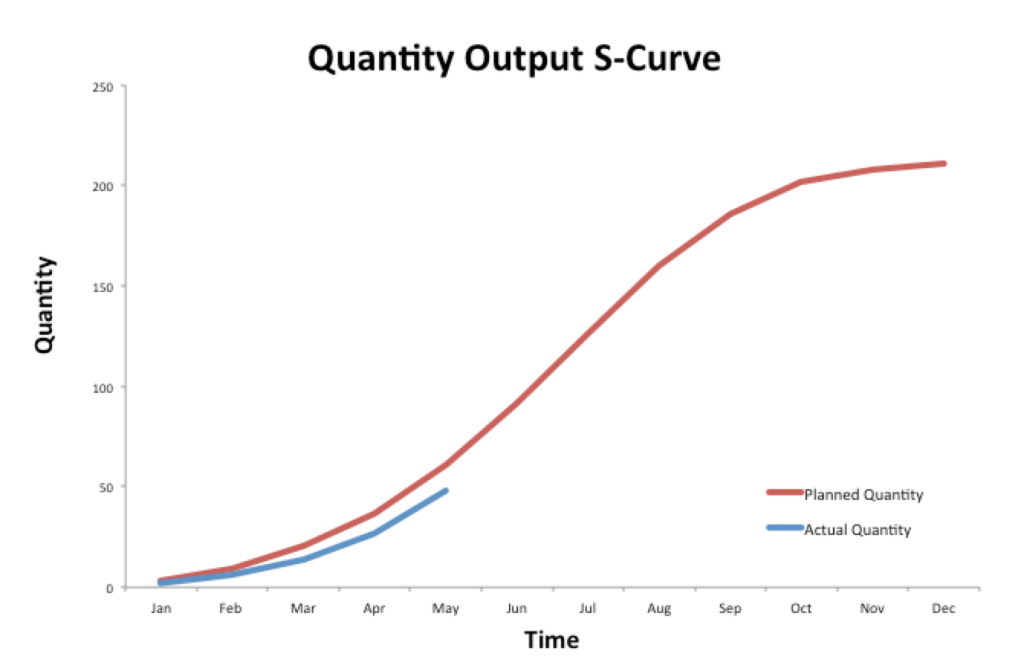
Quantity output comparison
S curves are to evaluate the quantity output that your project will yield. This is used more prominently in the construction and manufacturing industries.
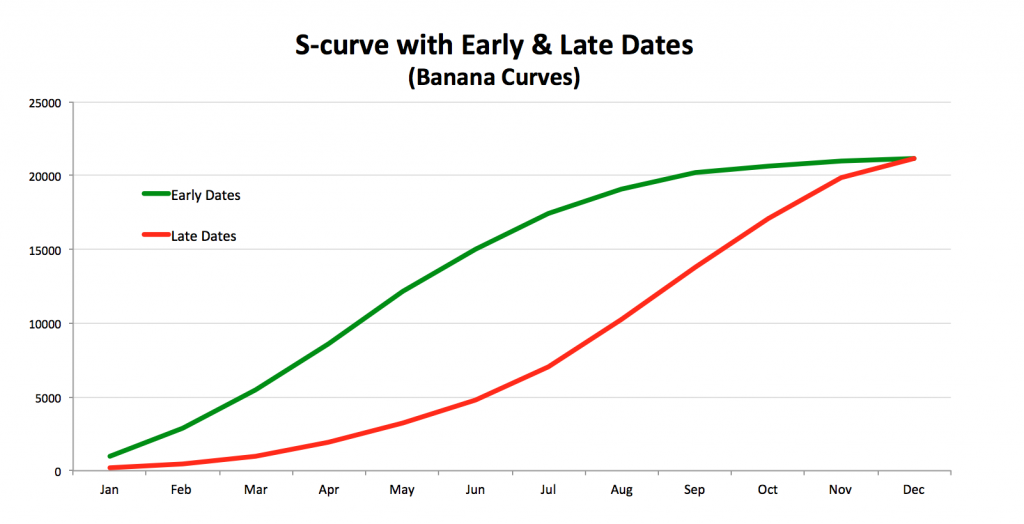
Schedule Range of Possibilities – Banana Curves
most scheduling software can easily drum up s-curves from schedulers using parameters like
- Quality.
- Man-hours.
- Cost.
The software can provide two types of S-curves; one according to the schedule early dates and another according to schedule late dates. These two S-curves typically overlap at the beginning and end of the project, producing a banana shape curve, known as “Banana Curves”.

Type of S Curve
The graph usually shows Something vs Time, as time is the common factor in all Project Management S Curve
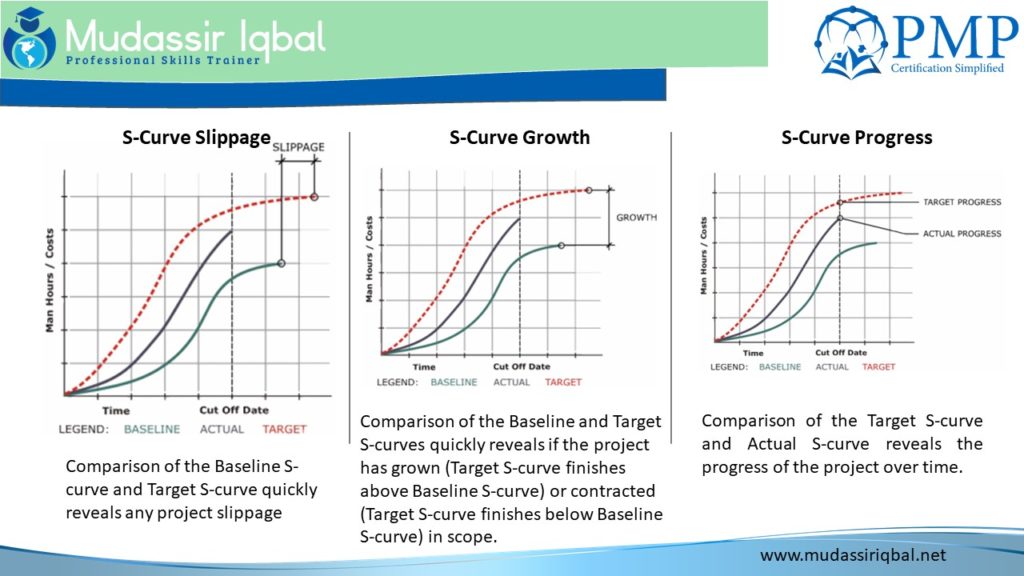
The standard S Curve: Baseline S Curve
This S-curve reflects the planned progress of the project. If the project requirements change prior to commencement (e.g. change of scope, delayed start), the Baseline Schedule may require revision to reflect the changed requirements.
The Growth Matrics; the target S Curve
This S-curve reflects the ideal progress of the project if all tasks are completed as currently scheduled. In an ideal world, the Target S-curve will meet the Baseline S-curve at the end of the project (On Time, On Budget) or finish below and to the left of the Baseline S-curve (Early, Under Budget
Actual S Curve
This S-curve reflects the actual progress of the project to date, and may be compared with the Baseline and Target S-curves to determine how the project is progressing
The Progress Metrics
The comparison between Target and Actual S Curve
Value and Percentage Metrics
- Value S-curves are useful for determining Man Hours or Costs expended to date, and Man-Hours or Costs to complete.
- Percentage S-curves are useful for calculating the project’s actual percentage complete against target and baseline percentage complete, and for calculating the project’s percentage growth (or contraction)
Cost Vs Time S Curve
It is appropriate for projects that contain labour and non-labour (e.g. material supply/hire/subcontract) tasks. It shows cumulative costs expended overtime for the duration of the project and may be used to assist in the calculation of the project’s cash flow and cost to complete.
Man Hour vs Time S Curve
is appropriate for projects that are labour-intensive. It shows cumulative man-hours expended overtime for the duration of the project,
S curve beyond project Management;
1. The Product Curve
2. The Technologically adoption
3. Revenue and Market share Growth
References
- The S-curve envelope as a tool for monitoring and control of projects by J.R. San Cristóbal*
- The Common Uses of S-curves in Projects
- The Mysterious S Curve by David Garland
- What is a S-Curve? by Consultant’s Mind
- S-Curve Fundamentals by Haider Ali Chughtai, PMP, RMP
- Explaining the S-Curve Theory & Analysis as Metrics Tools for Project Management
- Everything You Need to Know About S-Curve in Project Management

2 thoughts to “S-Curve : PMP/CAPM”
S curve is called “S” curve of because of its shape.
The curve takes S shape because of the data points.